case study
diction
A pronunciation trainer that scores each sound against what a native speaker actually sounds like, and reports how often it is wrong.
Local and offline. Nothing leaves the machine it runs on.
problem
The drill told native speakers they were wrong. It played a word,
listened to the reading, and flagged the sound when the acoustic
model's confidence fell below -5.0. One
number, applied to every sound in English.
On real speech it failed in both directions at once. A native
th came back flagged. A swapped vowel
passed, so ship read for sheep and wok for
walk cleared the bar. A single cutoff cannot tell a good
sound from a bad one, and the reason is the whole finding.
data
speechocean762 supplies 5,000 English clips from non-native speakers, each phoneme scored 0 to 2 by five human experts. That per-sound score is the ground truth a threshold can be fit against, and the corpus is Apache-2.0, so it ships.
The acoustic model ran over 2,500 of those clips to read off its confidence in each sound, a measure called Goodness of Pronunciation. Transcription was skipped: the words being read are known in advance, so only the acoustic model has to run, which cut an hours-long sweep to minutes.
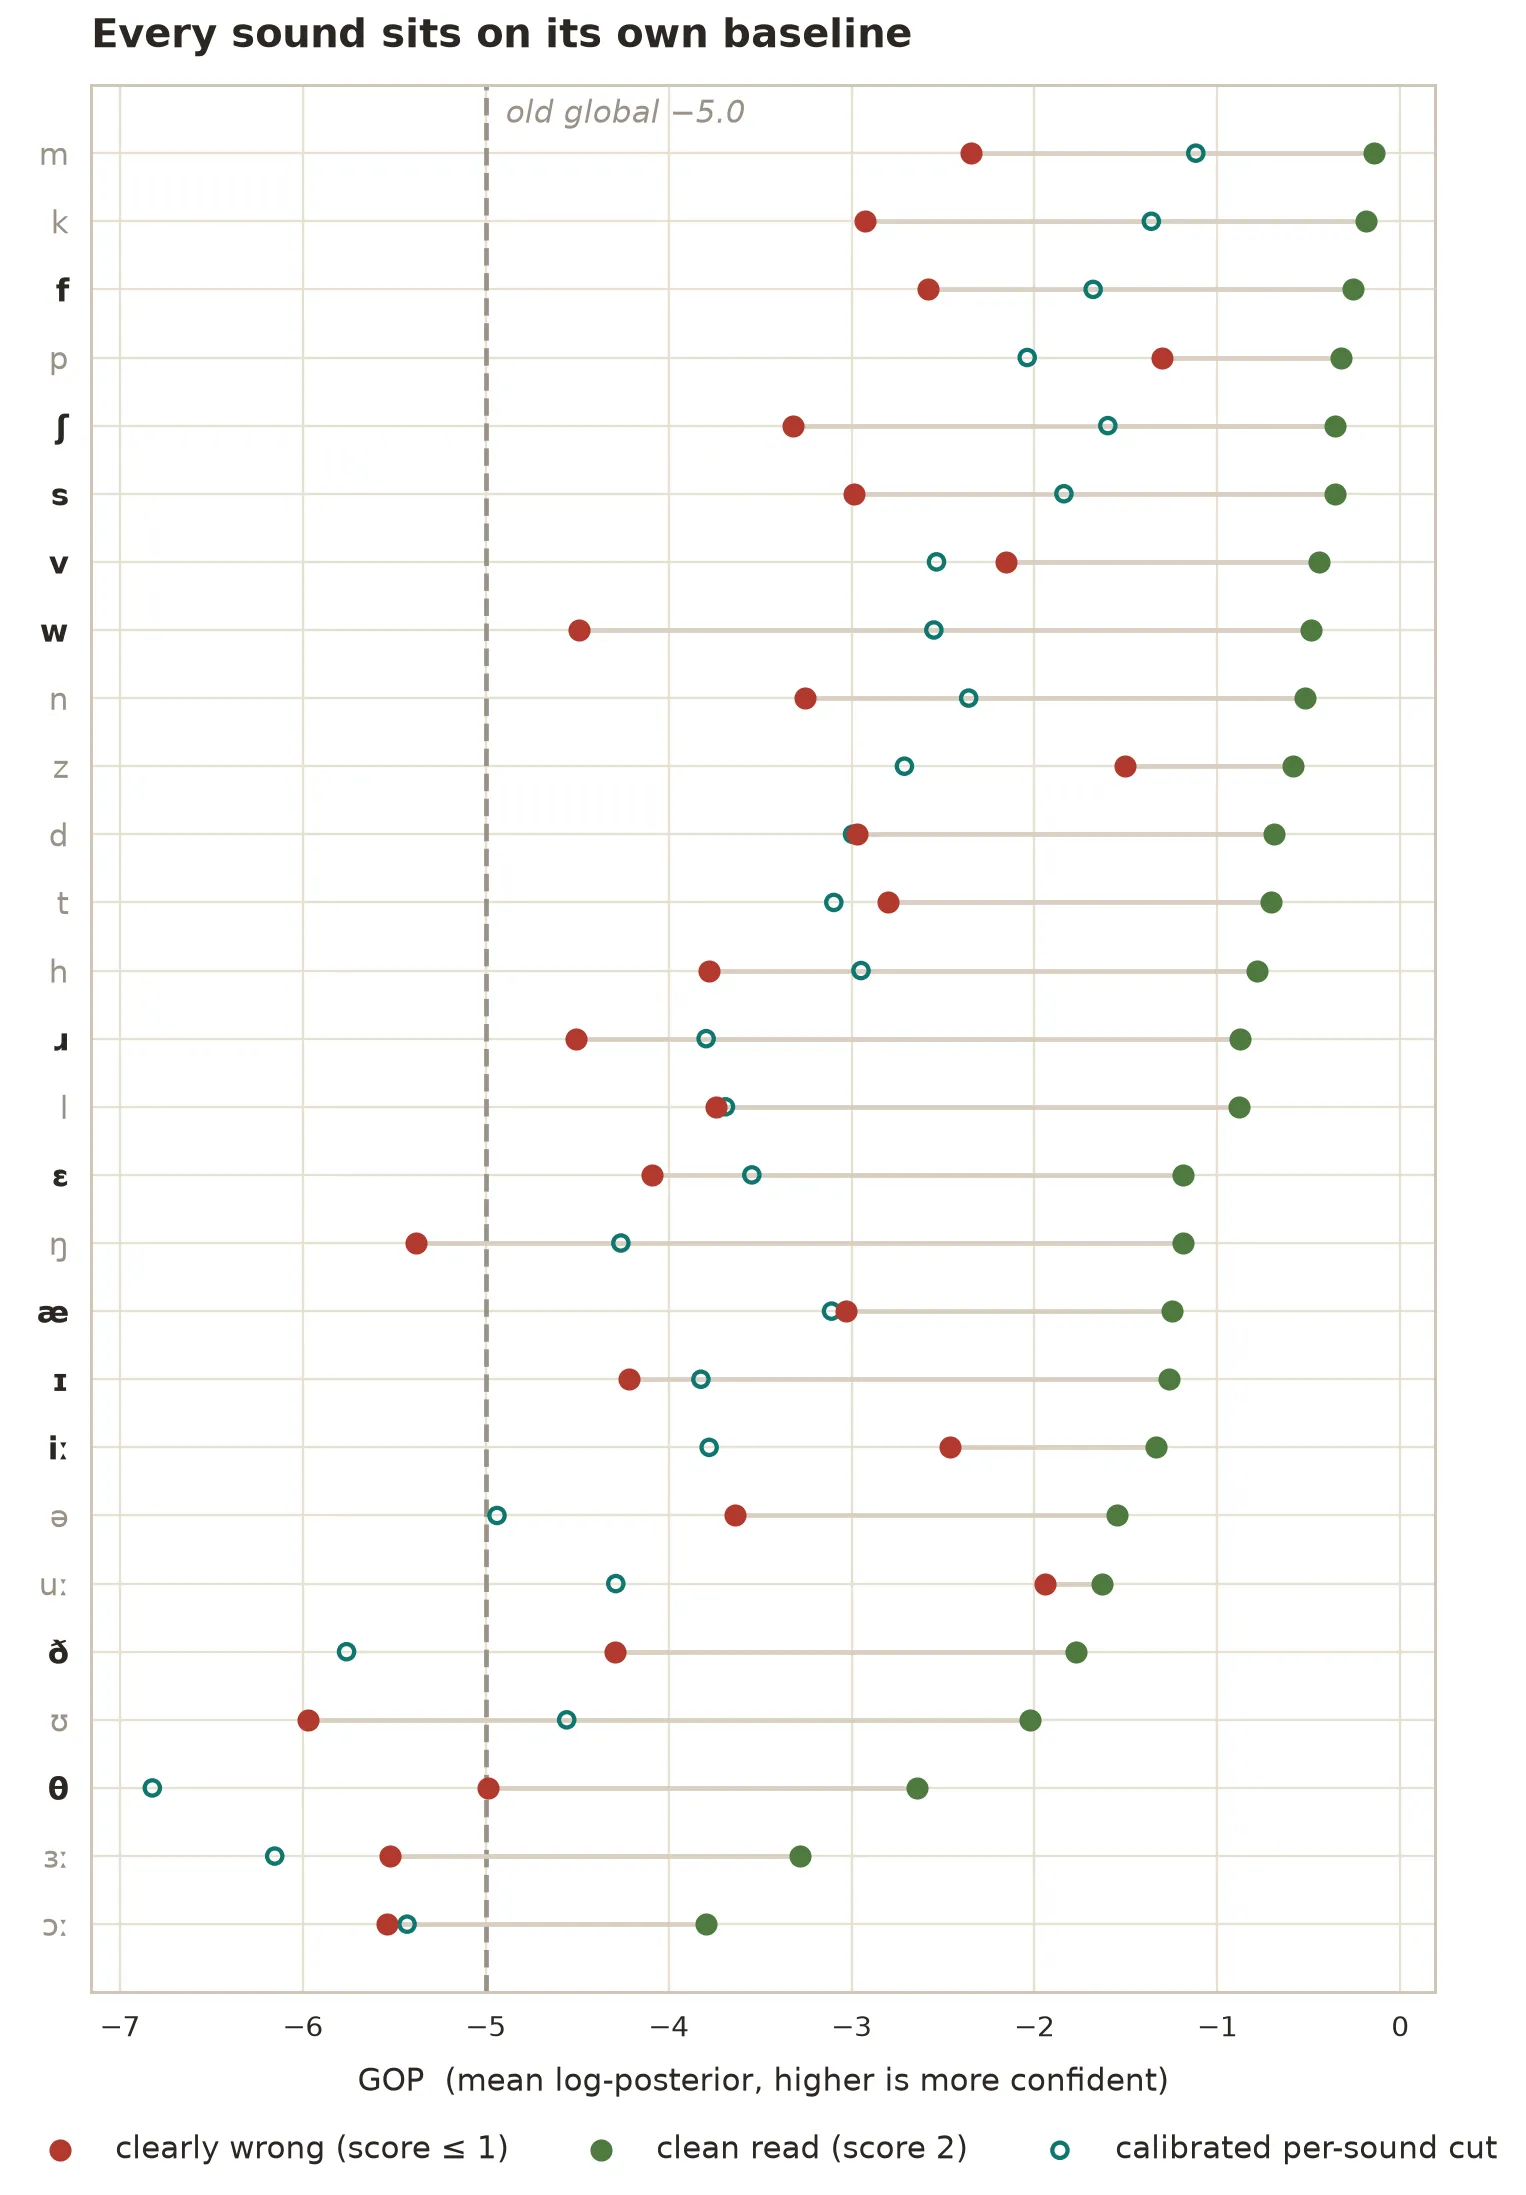
A native s sits near perfect
confidence. A native th averages
-2.6, because the model is less certain
about it even when a native speaker says it correctly. The clean and
wrong readings separate for every sound, and each pair sits at its own
place on the axis.
The old -5.0 line cuts none of it
cleanly. It falls so far left that a mangled
th still scores above it and passes,
while it clips the low end of confident vowels and flags them.
Different sounds do not share a baseline, so one vertical line was
never going to work.
fix
The rule became per-sound. For each phoneme, take the mean and spread of its native confidence, then flag a reading only where it falls more than 1.6 standard deviations below that sound's own mean. The cut travels with the sound.
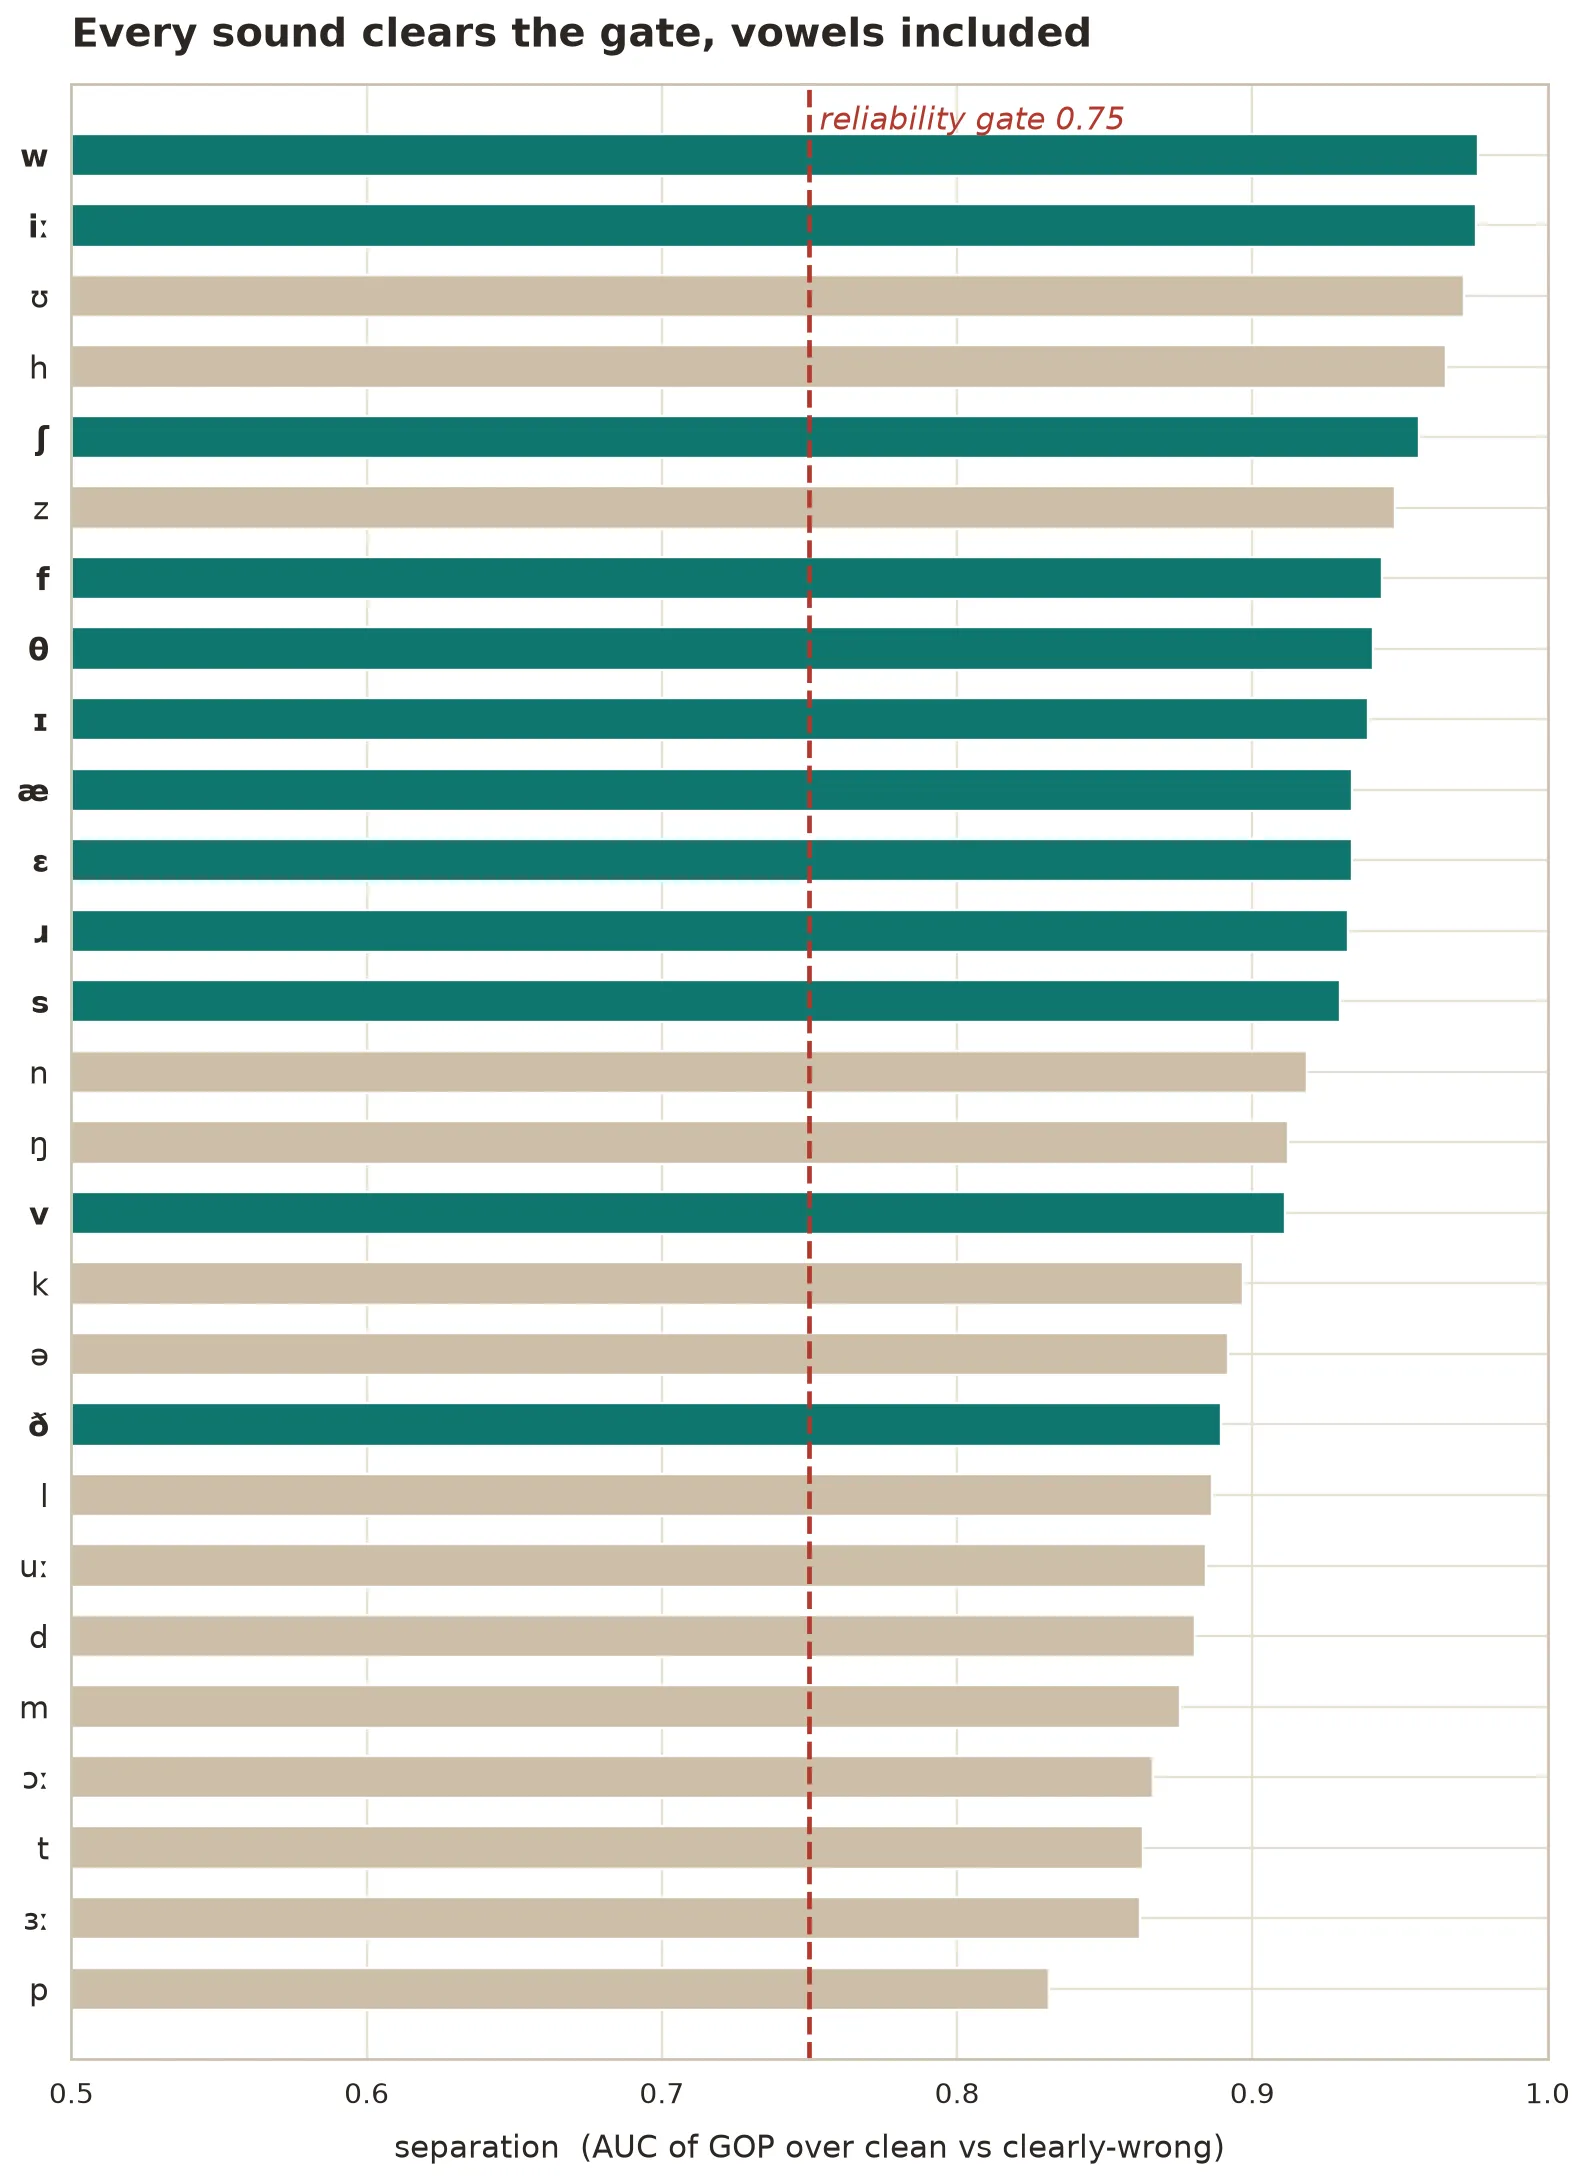
All 27 sounds separate, from 0.83 to 0.98. A reliability gate backs the rule up: a sound whose confidence failed to separate clean from wrong would be held out of the verdict rather than guessed at. Every sound clears it today, and the gate is there for the next model.
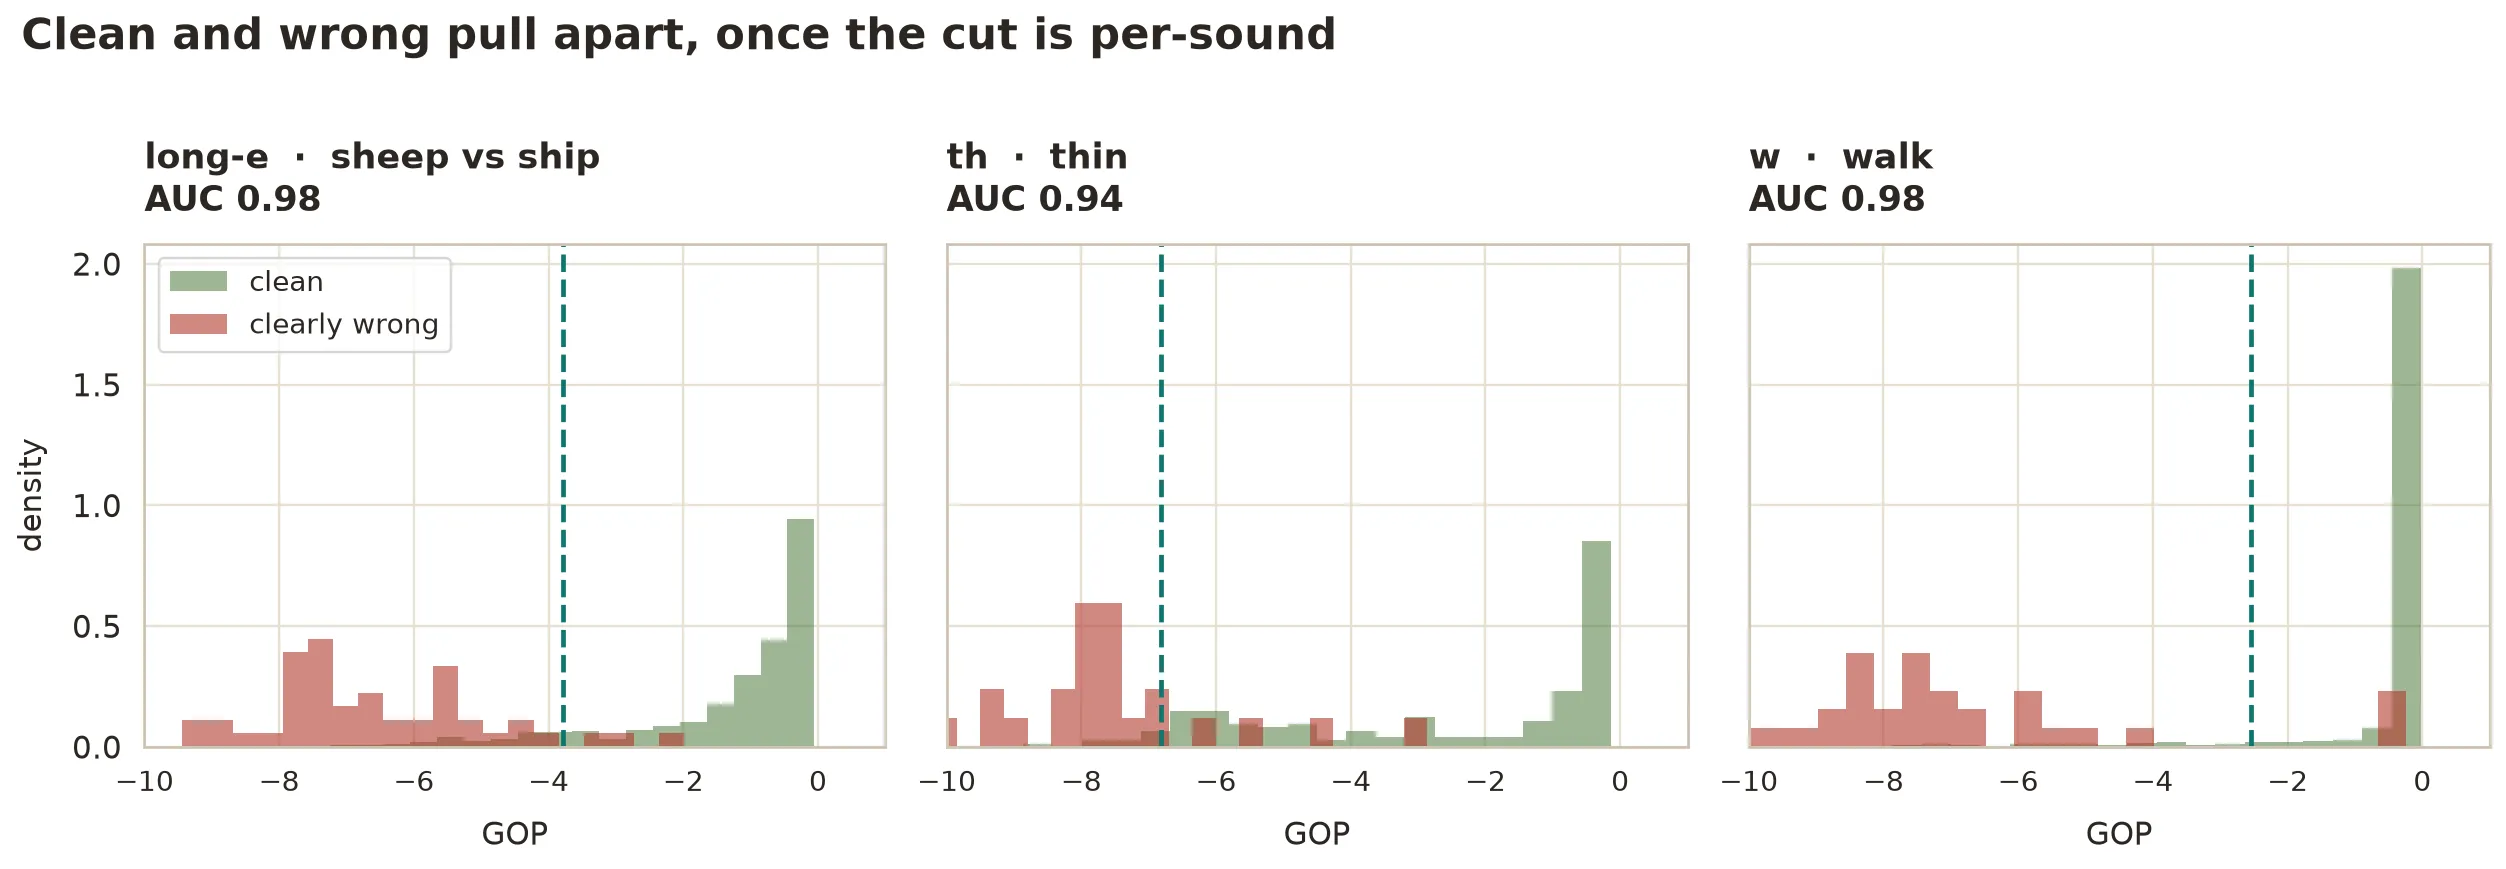
One earlier read had written the long-e vowel off as hopeless, its clean and wrong clouds apparently on top of each other. That came from comparing clean speech against borderline speech. Set against clearly-wrong readings, long-e separates at 0.98, as cleanly as any consonant. What a measurement is compared against decides what it concludes.
holdout
A rule fit to its own data proves nothing, so the thresholds were fit on one half of the corpus and measured on the other half, held out from start to finish.
On unseen speech it false-flags native readings 7% of the time and catches 66% of genuinely wrong sounds. That operating point is deliberate. Nagging a correct speaker erodes trust faster than missing an error does, so the cut keeps false alarms low and accepts that a third of subtle errors slip past.
It also fixes the two failures that started this. A native
th sits at its own baseline and passes.
A substituted vowel drops below its own line and flags.
beyond
Calibrating one score set the pattern for every other score the tool presents.
| score | what it was | what it is now |
|---|---|---|
| Minimal-pair verdict | The target sound's own native band | The competing sound scored at the target's aligned frames |
| Fluency | 100 * (1 - pause ratio) | Four timing features fit against human fluency labels |
| Interview gaze | A 15-degree head-turn gate | A 7-degree gate, sitting in the measured gap between takes |
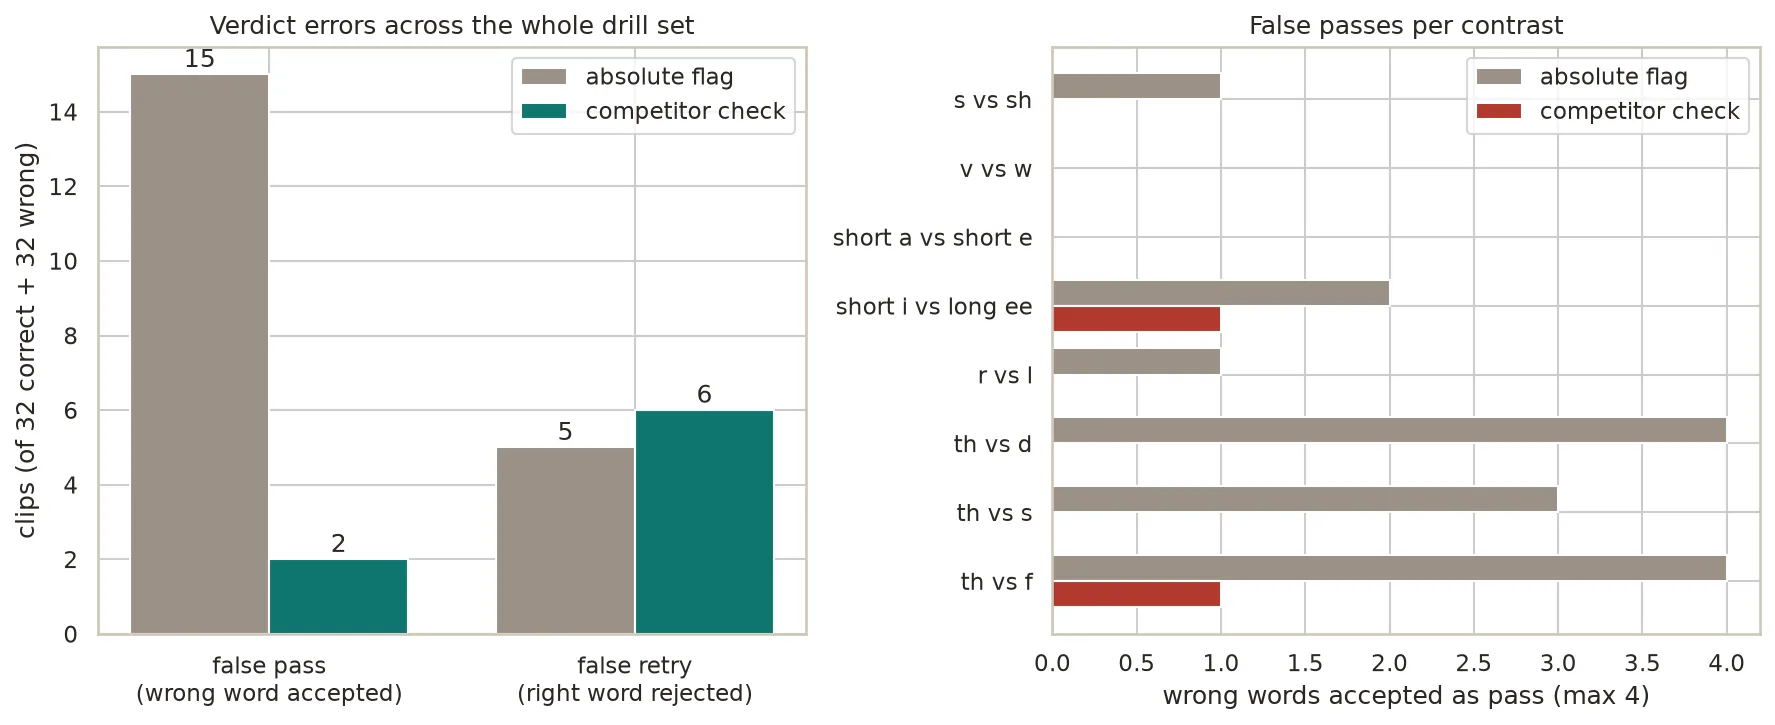
The minimal-pair drill asks a different question from the one the
phoneme flag was fit for: whether a reading was
θ rather than
f, not whether it was an acceptable
θ. Scoring the competitor at the
target's own frames cut wrong words accepted from 15 to 2 across 32
pairs, and moved right words rejected from 5 to 6.
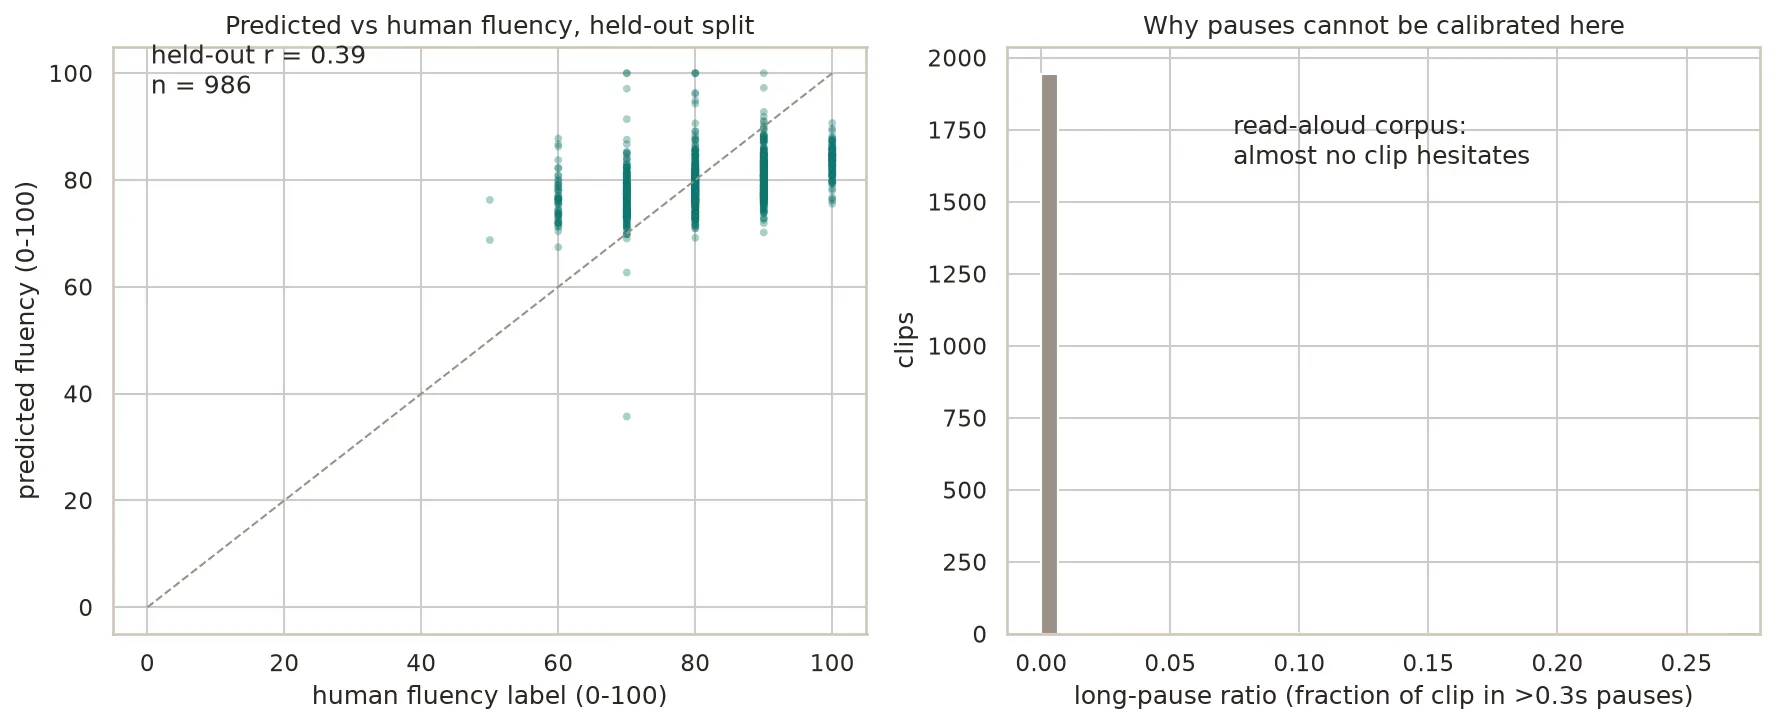
Fluency correlates with human judgment at 0.39 on held-out clips, matching its in-sample fit. That is real and modest, so the score reads as directional rather than as a grade. Two of its four features carry the result and the two pause features cannot be fit at all here, because a read-aloud corpus almost never hesitates. Those two stay reasoned rather than fitted, and the whole score is labeled for what it is.
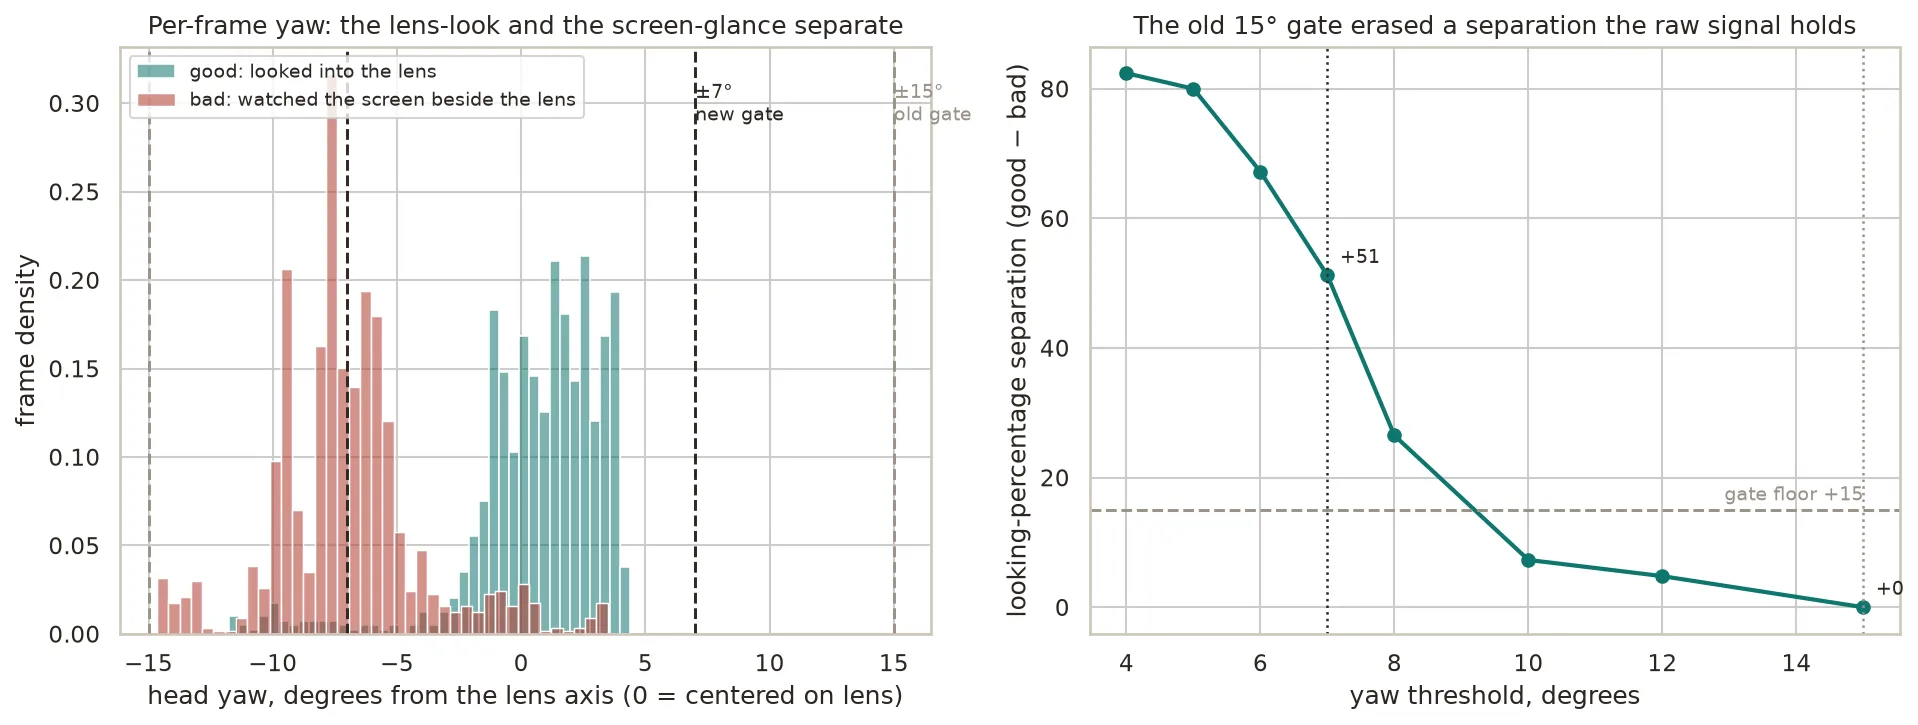
The interview gaze metric first read a lens-look and a screen-glance as identical, since both keep the head inside 15 degrees. The raw yaw separates them cleanly, at a median of +1.2 degrees against -7.3. Tightening the gate to 7 degrees recovers a 51-point separation. Two clips from one speaker is a separation check rather than a fit, and the threshold is a directional placeholder until more recordings arrive.
The flag is trustworthy now. The composite accent and prosody scores are still labeled directional, and they stay that way until real recorded pairs validate them. Calibrating a score presented as truth is the hard part, and that part is done.
The whole experiment lives beside the case study in the repository.
measure.py runs the sweep,
analyze.py fits the thresholds,
validate.py checks them on held-out
speech, and plots.py draws these
figures. The models and the dataset cache on first download, so a
re-run takes minutes.